Seeing the Future: Graphic Visualizations Help Showcase Project Potential
 By Chris Silewski, PLA
Bringing a client’s vision to life is part of an engineer, architect, or landscape architect’s job, but until construction begins, a 2D set of plan sheets may not be enough to help people visualize what the completed project could look like. How do consultants bridge this gap? Depending on the project, a number of alternatives are available to bring the theoretical closer to reality. 3D graphics and virtual reality help to establish a baseline for what a project will look like and show the available design alternatives.

About the Expert:
Chris Silewski, PLA, is a landscape architect who develops presentation graphics, computer renderings, and graphic visualizations to help convey design concepts to clients. Chris’ expertise expands Ayres’ capabilities in landscape architecture, planting design, site inventory and analysis, and construction detailing.
Not only does this allow the client to understand the end design, but it also paints a clear picture that the public can understand. And when your project depends on outside investment or community buy-in, the ability to accurately show the conceptual design is crucial.
What is a 3D project visualization graphic?
A 3D graphic is a computer-generated dynamic visualization of possible project improvements. Displayed in animated or still format, this medium helps to tell the story of each project. With context built into each 3D graphic, the story becomes place-specific to each audience that views it.
 Depending on the project’s size and the nearly limitless variations available, generating a 3D graphic can be a time-consuming but enlightening process. To save time and money, architects and engineers first put the client’s vision on a flat 2D page. Once consensus is built around the 2D graphic and what portions of the project the client would like brought into the visual medium, the next step is to develop a computer-generated 2D graphic, and then a 3D video showing one or more areas of a project. Whether they are being shown at public meetings or to potential investors, 3D graphics create a foundation for what a future project might look like while helping to develop consensus among a variety of potential stakeholders and users.
Benefits of a 3D project graphic:
- Effective communication of the end product to the public
- Marketable piece for potential investors
- Shareable resource that produces excitement for project completion
- Creation of the story of a project, not just a static image
- Potential for consensus building among different groups
- A lasting image
Case Study
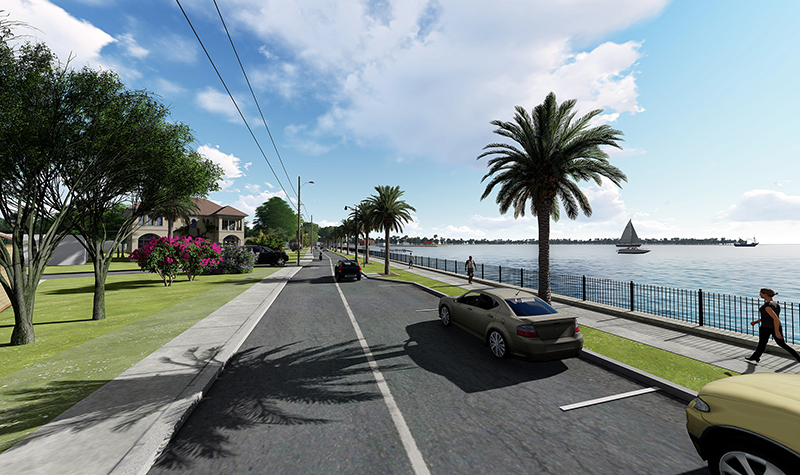
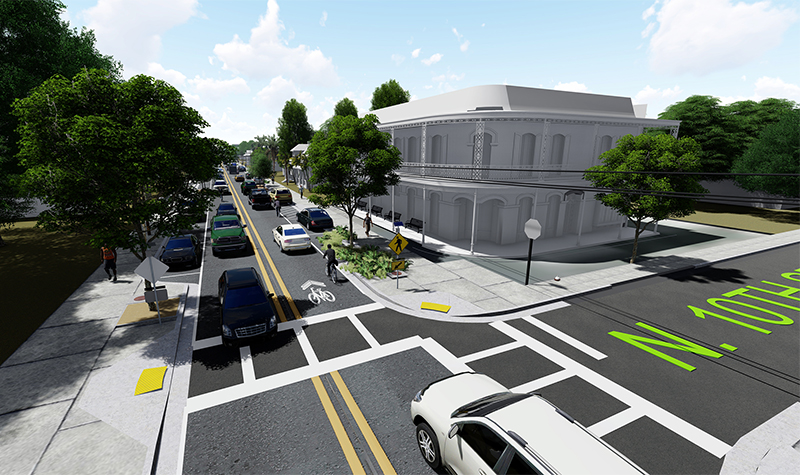
The reimagining of St. Johns Avenue is a key project for the small, northeastern Florida community of Palatka, and graphic visualizations have been a key component of engaging not only City officials but also the public. The planning process kicked off with an interactive community engagement session at the local craft beer festival, allowing for the public to offer feedback specific to the unique opportunities and constraints of St. Johns Avenue. While most public meetings are anchored by stale doughnuts, integrating our workshop with the local brewfest resulted in engaged (and chatty) participation.
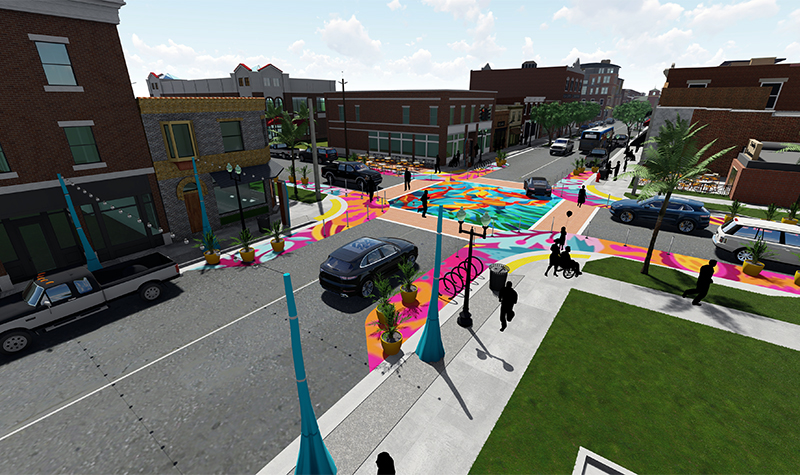 Through the use of 3D modeling and graphic visualizations, Ayres can showcase the design theme, which focuses on the creation of distinct walkable character areas unique to Palatka, which are anchored in the design identity of each individual street segment. The character of each “sub-district” is established through the architecture of the proposed buildings, district markers, and mural typology. The design process and decisions are underpinned by our 20 years of knowledge and partnership with the community and its residents, allowing St. Johns Avenue to come to life before construction even begins.
Contact Ayres’ Landscape Architecture experts, for more information on impact of graphic visualizations on showcasing projects.


Post a comment: